


Foot lbs or Pound ft = torque?

Tourer

Joined: May 2006
Posts: 269
Likes: 100
From: Florida
Also from my notes:
Power loss from weather
You can figure a 5-8% HP loss on a hot (90-95 degree), humid(70-75%)day with barometric pressure sitting around 30. That equates to about 10-12hp on a 200hp outboard -- or 2-3mph and 200-400rpm. That, of course, is figuring the 200hp is being made on a day when it's 68-degrees outside and humidity is closer to 45-50%. Days that are cooler than the "norm" will push the HP numbers the opposite direction.
When I was a pilot, caution was dictated when applying full power to an engine during low temperatures at or near sea level as the colder and denser air could allow for more than the rated hp to be developed and shorten the engine's life or overly stress its components.

HD EFI Guru


Joined: Jan 2008
Posts: 4,494
Likes: 4,779
The problem is you MUST control the environmental conditions that your running the testing under to comply with ANY of the standards! Most do not do it at all. If you do not do that then the results are pretty much useless. There are rules of how to run the testing and what conditions you can use the results. With all the game playing today to make a graph look one way or the other, it's gotten so bad about all you can do is use one dyno before and after your mod's. If your happy with the results then file the paper dyno sheet in the trash can. Forget what the picture looks like and get the result based on RPM so you can compare to the baseline as those numbers are what that one dyno measured before and after. It's a tool and when used correctly a very good tool.
The problem is you MUST control the environmental conditions that your running the testing under to comply with ANY of the standards! Most do not do it at all. If you do not do that then the results are pretty much useless. There are rules of how to run the testing and what conditions you can use the results. With all the game playing today to make a graph look one way or the other, it's gotten so bad about all you can do is use one dyno before and after your mod's. If your happy with the results then file the paper dyno sheet in the trash can. Forget what the picture looks like and get the result based on RPM so you can compare to the baseline as those numbers are what that one dyno measured before and after. It's a tool and when used correctly a very good tool.
Last edited by Ed Ramberger; Apr 24, 2022 at 05:56 PM.
Seasoned HDF Member
Joined: Dec 2005
Posts: 19,935
Likes: 8,036
From: poway
It's also why hp wins races. Contrary to popular belief.
More hp means = more torque hanging on longer.
Torque isn't always higher than hp in an HD twin cam either. Depends on the cam mostly. But bore vs stroke to some extent too. An all bore 107 will typically have more square numbers than a "stroker" 107 with the same cam. Exhaust plays a part to some extent too.
I prefer more square numbers personally. My 127hp/126ft.lbs. in a "stroker" 107 is because of the cams mostly and to some extent the pipes.
And notice since both are scaled the same(100 on one side lines up with 100 on the other side, etc) hp and torque cross at 5252rpm.
Now take my peak torque of 126.37 and multiply it times the rpm it occurs at(4350) and you get 549,709.5 and divide that by 5252 and you get the 104.66hp that occurs at the same rpm(4350). Simple. Doesn't get any simpler than that.
Mostly cam? Didn't you forget about heads and throttle bodies? Intake tract length? You forgot about Dorfman already?
The thing about overshare under square shows that really don't understand engine builds. Look at the power bands of some large offroad dirt bikes..
It's good to see that you understand how to plug numbers into an equation and get results..
Seasoned HDF Member
Joined: Dec 2005
Posts: 19,935
Likes: 8,036
From: poway
I said it's something I just came across for the sake of discussion. How accurate it is I don't know. But what makes one right and one wrong based on actual conditions vs a set of predetermined conditions?
I don't know. That's why I post both. The difference between them was more like 2%.
So one uses a lower temp, humidity, etc. standard than the other? But both use these correction standards?
What's the difference between dynos and what makes one more right than the other?
I don't know. That's why I post both. The difference between them was more like 2%.
So one uses a lower temp, humidity, etc. standard than the other? But both use these correction standards?
What's the difference between dynos and what makes one more right than the other?
Both SAE and STD are simply an attempt to correct dyno outputs to a standard temp/pressure and humidity. "Actual HP/TQ" represents the HP/TQ measured at the time the motor was run. The problem is that unless you have a large chamber that keeps all those parameters the same, you get errors in measurement that may skew changes. Make a change while the temps drop and pressure increases, you might be mislead as the fact that motor made more HP when it didn't.
If you are trying to figure out which correction is better, don't. They simply produce different numbers. If you want to measure your ****** size, use mm over inches..
 Once you compare you numbers look better until you find out everyone else uses inches.
 Dynos are different. If comparing motors it's best to use the same dyno same correction factor. An even better way to compare is side by side at the track. Look at the speed through the traps.
HD EFI Guru
Joined: Jan 2008
Posts: 4,494
Likes: 4,779
Best street test is to find an open area where you can safely time the acceleration of the bike. 3rd gear works nicely for this and let the engine run at 1400 RPM in third then go WOT and hold it until your redline with a timer running, save the acceleration time for your baseline. Then after mods repeat on the same spot, same test. Since this makes it a one gear pull there is no tricks that can be played. This gives you a good measure of the improvement, as there is way to much cheating of dyno reports anymore these days. Back when none of the games were being played, it meant something, but the Internet sales guys have ruined that.
Thread Starter
|
Stellar HDF Member


Joined: Jun 2018
Posts: 2,296
Likes: 494
From: WI
Steve Cole, Max Headflow, Mr. Ed Ramburger, Idaho hacker, And all the rest of you, too many to put names down to, this thread has been a good read. I appreciate everyone of you sharing your knowledge. I mean all of us here have learned a little bit about a lot. And lots about a little bit. My hats off to you gentlemen, and as I always say
…………………….. Knowledge Is Power …………………..
…………………….. Knowledge Is Power …………………..

Tourer
Joined: Nov 2006
Posts: 283
Likes: 44
From:
Determining ft-lb or lb-ft depends on perspective:
Generally speaking,
If you apply 5 lb of force to a 2 ft lever, it's 10 lb-ft. If you use a 5 ft lever and apply 2 lb of force, it's 10 ft-lb.
Using a torque wrench,
If you set your 2 ft torque wrench to 10 ft-lb and apply 5 lb of force, you've applied 10 ft-lb.
If you apply 5 lb force to a 2-ft torque wrench set at 10 ft-lb, you've applied 10 lb-ft.
On a dyno,
If your dyno is measuring pounds of force based on what is senses from a ft-calculated sensor, you get lb-ft.
If your dyno is measuring a ft-calculated sensor and senses pounds of force, you get ft-lbs.
HD Forum Stories
The Best of Harley-Davidson for Lifelong Riders
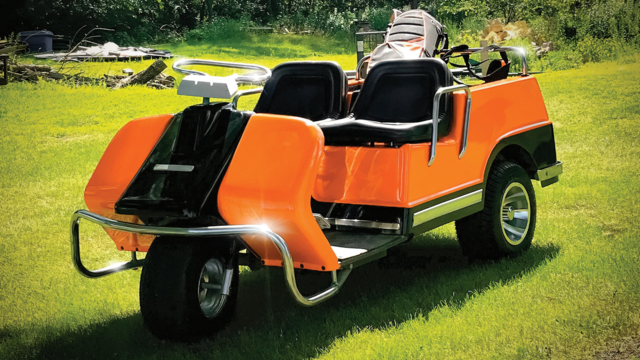
7 Surprising Harley-Davidson Products that Are Not Motorcycles
Verdad Gallardo
8 Best Harley-Davidson Motorcycles Ever
Pouria Savadkouei
10 Worst Harley-Davidson Motorcycles Ever
Pouria Savadkouei
Killer Custom's Jail Break Is The Breakout That Refused to Blend In
Verdad Gallardo
Crazy Bunderbike Build Looks Amazing, But Is It Impossible to Ride?
Verdad Gallardo
Harley-Davidson Reveals Super Cool Cafe Racer Concept
Verdad Gallardo
Engraved Rebellion: Inside Bundnerbike's Glam Rock II
Verdad Gallardo
10 Motorcycles You Should Never Buy
Joe Kucinski
10 Things Harley-Davidson Needs to Fix in 2026
Verdad Gallardo
Grand HDF Member
Joined: Sep 2017
Posts: 4,359
Likes: 1,219
From: Dubuque, IA
Best street test is to find an open area where you can safely time the acceleration of the bike. 3rd gear works nicely for this and let the engine run at 1400 RPM in third then go WOT and hold it until your redline with a timer running, save the acceleration time for your baseline. Then after mods repeat on the same spot, same test. Since this makes it a one gear pull there is no tricks that can be played. This gives you a good measure of the improvement, as there is way to much cheating of dyno reports anymore these days. Back when none of the games were being played, it meant something, but the Internet sales guys have ruined that.
It's also why I questioned the whole SAE vs STD correction. The difference is pretty minor given all the ways, intentional or not, that the results can skewed. As much as 30% and more! The question then becomes where to stop so as not to be obvious about it. Even making the initial run look worse than it actually is to make the tune look that much better. Just the fact it's done first will make it worse.
Here's a real eye opener on just what I'm talking about. Even the fact I run conventional oil vs synthetic can cost as much power as the difference between SAE and STD. (3%)
Where sensors for the dyno are located is just one of countless ways.
Well I had a link posted but it won't let me link it and it's way too much to copy/paste in even 2 responses but the ways to skew results are endless.
Last edited by 60Gunner; Apr 27, 2022 at 09:53 AM.
Tourer
Joined: Nov 2006
Posts: 283
Likes: 44
From:
Best street test is to find an open area where you can safely time the acceleration of the bike. 3rd gear works nicely for this and let the engine run at 1400 RPM in third then go WOT and hold it until your redline with a timer running, save the acceleration time for your baseline. Then after mods repeat on the same spot, same test. Since this makes it a one gear pull there is no tricks that can be played. This gives you a good measure of the improvement, as there is way to much cheating of dyno reports anymore these days. Back when none of the games were being played, it meant something, but the Internet sales guys have ruined that.
I'd have to agree with this. It's how I tune without a dyno. Not as accurate by any means but can get you pretty damn close if you have the patience, monitor sensors, reading logs, etc.
It's also why I questioned the whole SAE vs STD correction. The difference is pretty minor given all the ways, intentional or not, that the results can skewed. As much as 30% and more! The question then becomes where to stop so as not to be obvious about it. Even making the initial run look worse than it actually is to make the tune look that much better. Just the fact it's done first will make it worse.
Here's a real eye opener on just what I'm talking about. Even the fact I run conventional oil vs synthetic can cost as much power as the difference between SAE and STD. (3%)
Where sensors for the dyno are located is just one of countless ways.
Well I had a link posted but it won't let me link it and it's way too much to copy/paste in even 2 responses but the ways to skew results are endless.
And do each run 3 times to minimize/reduce error.
When I was doing my viscosity testing, I ran each test at least 10 times. I had found that when I first started, my timing was off, causing a 40% error. I found that in the first 5, so I ran 10 each when I corrected my timer. Then my high/low variance was <10%.
Last edited by Wide06; Apr 27, 2022 at 10:29 AM.