

No Device: scatter graphs and statistics
Thread Starter
|
Road Warrior


Joined: Mar 2013
Posts: 1,923
Likes: 587
From: Alorton, Illinois
Here is four different Sporty tunes. The first is tuned with Narrow bands and mostly using autotunes.
http://www.nbs-stl.com/HarleyTuning/...d%20Sporty.png
Now two Target Tune equipped bikes.
http://www.nbs-stl.com/HarleyTuning/...Sporty%202.png
http://www.nbs-stl.com/HarleyTuning/...d%20Sporty.png
And a Dyno tuned TTS bike with the wideband option being used.
http://www.nbs-stl.com/HarleyTuning/...d%20Sporty.png
Andy
http://www.nbs-stl.com/HarleyTuning/...d%20Sporty.png
Now two Target Tune equipped bikes.
http://www.nbs-stl.com/HarleyTuning/...Sporty%202.png
http://www.nbs-stl.com/HarleyTuning/...d%20Sporty.png
And a Dyno tuned TTS bike with the wideband option being used.
http://www.nbs-stl.com/HarleyTuning/...d%20Sporty.png
Andy
Notice how the graph he post for the narrow band and mostly autotunes. The hit dots are huge, but then the TT equipped bikes the hit marks are tiny. This a carney trick some play with scaling to show you an apples to oranges comparison being played off as a apples to apples.
Shame on you Andy. Continuing to post BS and BS data should be ground to get you kicked out of here.
Road Master
Joined: Mar 2007
Posts: 1,177
Likes: 23
No, you are good posting that here. I have no problem with people bringing info and questions to the table.
I would be concerned ate the top right corner of that plot. It is likely something is wrong in the tune.
Wow you are good at Excel. You would go over the top if you had software designed for doing this sort of thing from day one.
Andy
I would be concerned ate the top right corner of that plot. It is likely something is wrong in the tune.
Wow you are good at Excel. You would go over the top if you had software designed for doing this sort of thing from day one.
Andy

Road Warrior

Joined: Jun 2015
Posts: 1,325
Likes: 140
From: Edinburgh UK
That is probably the log I sent you last time. I wasn't sure how interesting the AFR was on that particular display TBH??
On a half decent Lambda/AFR table you would expect it to go from leaner at idle cruise, out to richer at higher loads i.e. out towards right/top of that graph, no?
On that kick, the Rear is noticeable but the Front not so, to my eye ...or do you think there is a bit something up on both? I'm wondering just how straight do you think those lines should be?
Road Master
Joined: Mar 2007
Posts: 1,177
Likes: 23
Assuming the AFR is reasonable and linear, HP is a function of Duty Cycle. If the fuel going to one cylinder makes a big bend, you should see a matching dip in power from that cylinder.
see http://www.nbs-stl.com/HarleyTuning/...20to%20MLV.png
Andy
see http://www.nbs-stl.com/HarleyTuning/...20to%20MLV.png
Andy
Thread Starter
|
Road Warrior
Joined: Mar 2013
Posts: 1,923
Likes: 587
From: Alorton, Illinois
I did post raw data. Haven't seen you post anything besides the same screen shots you have been posting for years.
Keep talking Andy. You are helping me with why I started this thread. You have done nothing but play games, topic hop, avoid questions and show your ignorance of how a HD ECM works. You haven't backed up a single statement. You have proved just pics of scatter plots are not enough and how they really don't do anything. Even you want the raw data.
"You would go over the top if you had software designed for doing this sort of thing from day one."
What, like TT software, because you couldn't tune your sportster with MLV until you installed TT?
I have software designed for doing this, but don't worry. I do have MLV also.
BUT none of this has shown how scatter plots can be used for tuning.
Thread Starter
|
Road Warrior
Joined: Mar 2013
Posts: 1,923
Likes: 587
From: Alorton, Illinois
That's why you should post raw data.
HD Forum Stories
The Best of Harley-Davidson for Lifelong Riders
7 Surprising Harley-Davidson Products that Are Not Motorcycles
Verdad Gallardo
8 Best Harley-Davidson Motorcycles Ever
Pouria Savadkouei
10 Worst Harley-Davidson Motorcycles Ever
Pouria Savadkouei
Killer Custom's Jail Break Is The Breakout That Refused to Blend In
Verdad Gallardo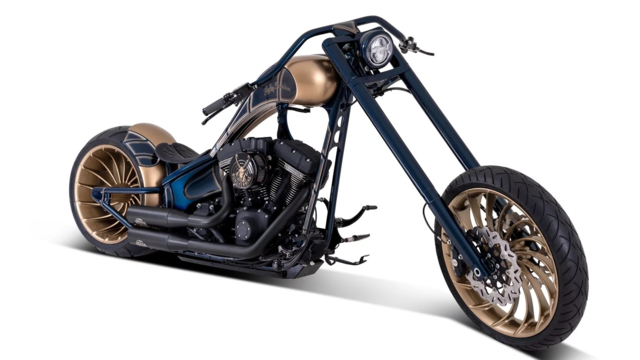
Crazy Bunderbike Build Looks Amazing, But Is It Impossible to Ride?
Verdad Gallardo
Harley-Davidson Reveals Super Cool Cafe Racer Concept
Verdad Gallardo
Engraved Rebellion: Inside Bundnerbike's Glam Rock II
Verdad Gallardo
10 Motorcycles You Should Never Buy
Joe Kucinski
10 Things Harley-Davidson Needs to Fix in 2026
Verdad GallardoThread Starter
|
Road Warrior
Joined: Mar 2013
Posts: 1,923
Likes: 587
From: Alorton, Illinois
Like Gordon points out. AFR isn't linear. On WOT pull from 1750 to 6500 the AFR can be a bit richer at the bottom to address hard roll on detonation, and then lean out in the middle of this and then richen back up when PE mode kicks in. When does PE mode kick in? All depends on how it is set up and how long the bike is at 100kpa or 100tps depending on what level of calibration it is.
HP is not a function of duty cycle. Duty cycle of an injector is nothing more than how long the injector is open compared to the allowable time it has to be open displayed in a percentage.
Lets look at an look at 6000 RPM's for an example. At 6000RPM's you have 20ms to spray fuel between intake valve close to next intake valve close event. If the injector is energized for 16ms. That would be considered to be a injector duty cycle of 80%. Because the injector is staying open 80% of the time it could be open and get fuel for that engine event. Let's look at 5000RPM's. In order to have a 80% duty cycle at 5000 with a the allowable time to spray of 24ms. The injector needs to be energized for 19.2ms. It doesn't tell you anything more than that. How much fuel is that? Who knows. More info is needed. Like what size of injector is it.
So, Andy is now blaming DC for the reason the sportster I posted isn't carrying its power to redline. After he has tried to blame other things and have been shot down. The straw he is grasping for is IDC. Here is the problem with that. How much fuel being delivered doesn't determine the amount of power. If this was so. Why wouldn't we just run all WOT at 10:1 or richer? Just keep adding fuel until we are on the verge of washing cylinders? Because it takes fuel and air to make power. Engines/ fuel types like a specific ratio of both to make power. So, if you look at data and see that there is no more air getting into the engine from 5200 on up. Chances are the power is going to flattened out. If we see that the engine isn't taking more fuel over 5200 but the ratio stays at our desired ratio. Chances are the power is going to flatten out. Doesn't take a wiz bang program to see this. What can be the cause of lack of air? Head, cams, intake, exhaust. Or look at it this way. How can we get more air through the engine up at these RPM's? Why does headwork and larger TB's produce this power up top? Because this lets more air to be pumped through the engine. Which allows the addition of more fuel and with both. That equates to more power.
This is all some pretty basic stuff guys, and as we see. Andy doesn't have a clue.
Last edited by hrdtail78; Jun 30, 2016 at 11:44 AM.
Road Master
Joined: Mar 2007
Posts: 1,177
Likes: 23
Lets see if we can explain the PW and DC stuff
Let's take a simple motor running 2500 rpm. That works out to 48 ms to rotate the crank shaft 720 degrees or one full engine cycle.
Lets assume the code is reporting a Pulse Width of 8.86 ms
8.86 ms / 48 ms = .1846 or 18.46% Duty Cycle.
But the dead time of a fuel injector is about 1 ms, so the actual spray time is
(8.86 ms - 1 ms) / 48 ms = .1637 or 16.37% Duty Cycle effective fueling time. Let's say we find that the AFR as read by the wideband.
Now let's see what happens if we change the PW to 7.98 ms.
(7.98 ms - 1 ms) / 48 ms = .1454 or 14.54% Duty Cycle
16.37 Effective DC / 14.54 Effective DC = 1.126 or a 12.5% change in fueling.
8% to 10% is normally about one AFR so 12% is close to 1.5 AFR or the 14 AFR we had at 8.86 pulse width will end up about 15.5 AFR
If you take 14 AFR * 1.126 = 15.8 as the new AFR in theory. That is real close to our 15.5 AFR Rule of Thumb guess.
So a swing of Pulse Width of 8.86 to 7.98 will swing the AFR right at 1.5 AFRs if there is no other changes in RPM or throttle position or MAP.
Everyone follow me so far?
Andy