

No Device: scatter graphs and statistics
Thread Starter
|
Road Warrior


Joined: Mar 2013
Posts: 1,923
Likes: 587
From: Alorton, Illinois
Here is what a BIG Twin with fuel cut enabled looks like. Notice how the Pulse Width does not get much below 2ms. Also the Duty cycle never gets over 75% DC.
http://www.nbs-stl.com/HarleyTuning/...Big%20Twin.png
Andy
http://www.nbs-stl.com/HarleyTuning/...Big%20Twin.png
Andy
Uh, I see both go to zero. That is what fuel cut off is. You really need to start logging your own data instead of just getting screen shots from MLV. If you did this and played around with different injectors. It might help you learn something.
Thread Starter
|
Road Warrior
Joined: Mar 2013
Posts: 1,923
Likes: 587
From: Alorton, Illinois
I guess Andy isn't going to address my question of showing data. Making a statement and having the data not back up what you are saying. O well, we will move on.
3d graphs are great for looking at an over view of the log. It's a good way to look at a bunch of data all at once.
This is going to based in TTS, but the files can be converted to use MLV or any program that has 3d capability. Since it is already built in. I didn't go through the trouble of converting.
The bike is a dyna, 117, 13.85 compression, S&S 675, Burns exhaust, 62mm TB. Pump gas. This is worse case here and a good example.
When logging Vtune data of the calibration and trying to generate a new calibration. I am missing a lot of changes that I now I got by looking at the data in the histogram. (I couldn't get a shot of that, open it up and run it) I didn't know why. So, I want to look at all of it in an overview. In a quick view I can see that it is pulling a bunch of timing. When it does this. Vtune considers this data garbage in this area and filters it out. Look at the attached pic and you can see the hole in my generated calibration. This can also be seen in the Vtune program but this is a TPS base VE table, and looking at it with TPS/RPM puts it in the same as VE table.
Thread Starter
|
Road Warrior
Joined: Mar 2013
Posts: 1,923
Likes: 587
From: Alorton, Illinois
Thanks. That is what I was trying to do. Had a XPS file I couldn't deal with.
Anyway. I can pull up this graph and in an instant see I got way too much timing for this thing.
Thread Starter
|
Road Warrior
Joined: Mar 2013
Posts: 1,923
Likes: 587
From: Alorton, Illinois
With the difference of TPS and KPA VE tables. I like to see with different TB's when I am actually getting up to 100kpa at different rpm's at different TPS. Graphs are a good way to see this.
This is how I use these. As an overall view. I wanted to get a shot of roll on spark activity, but I don't have my files labeled like that. BUT I think it is great for that. When I am checking timing. I pull up a graph and look at that area. If I can collect data through that area about 3-4 times. You can see how it usually isn't just one cell but several of them, and after you remove the timing and blend. You are taking timing away from an area. Not just 1 or 2 cells. Like stated. This is a overall view and before I make a determination or actually change anything in the calibration. I am going back to a trace so I can get a time stamp, because as we know. What we see in spark activity is the ECM's reaction to the spark activity. Knock happened a couple of frames before.
Hope this helps. I know it isn't anything WOW about it, but I don't see much WOW about 3d graphs.

Cruiser
Joined: Nov 2005
Posts: 163
Likes: 10
From: Wherever I put my helmet
To me it is a WOW. Pops right out at you and gives you a location to to look at in the data stream
And that folks is how it should be done IMHO. You can't just throw up a picture and expect people to see what you see and are looking for. With the raw data being supplied along with the picture, allows you to bring up on your screen and examine it, providing you have the means to do it. Then you can look at the data and have a talking point about it. Disseminate all the info and learn. I did plot it as a scatter type graph and while I could discern it, it just doesn't jump out. I had to know where to look. I could find it looking at the data without the 3-D graph but the graph helped to shorten the search time. Also having the data on hand allowed me to swap the axises. Sometimes I get a better view of something if I can flip it around.
And that folks is how it should be done IMHO. You can't just throw up a picture and expect people to see what you see and are looking for. With the raw data being supplied along with the picture, allows you to bring up on your screen and examine it, providing you have the means to do it. Then you can look at the data and have a talking point about it. Disseminate all the info and learn. I did plot it as a scatter type graph and while I could discern it, it just doesn't jump out. I had to know where to look. I could find it looking at the data without the 3-D graph but the graph helped to shorten the search time. Also having the data on hand allowed me to swap the axises. Sometimes I get a better view of something if I can flip it around.
Thread Starter
|
Road Warrior
Joined: Mar 2013
Posts: 1,923
Likes: 587
From: Alorton, Illinois
A couple of things. When I collect Vtune data. I set to dyno. If you do this. The histogram will look more filled in or it will be all blue. The other thing is. Take the calibration and log and run it through Vtune3. That is where you will see a bunch of yellow.
HD Forum Stories
The Best of Harley-Davidson for Lifelong Riders
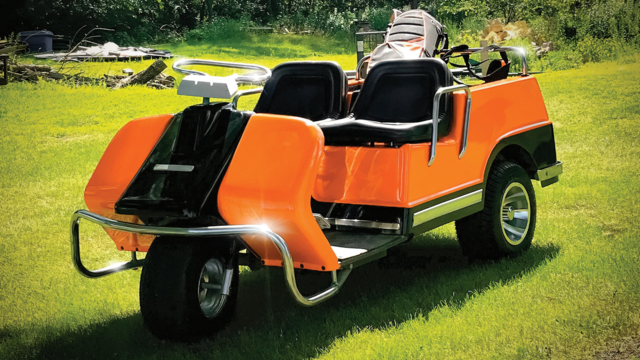
7 Surprising Harley-Davidson Products that Are Not Motorcycles
Verdad Gallardo
8 Best Harley-Davidson Motorcycles Ever
Pouria Savadkouei
10 Worst Harley-Davidson Motorcycles Ever
Pouria Savadkouei
Killer Custom's Jail Break Is The Breakout That Refused to Blend In
Verdad Gallardo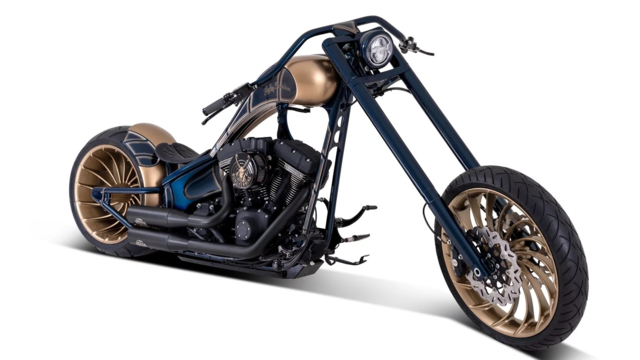
Crazy Bunderbike Build Looks Amazing, But Is It Impossible to Ride?
Verdad Gallardo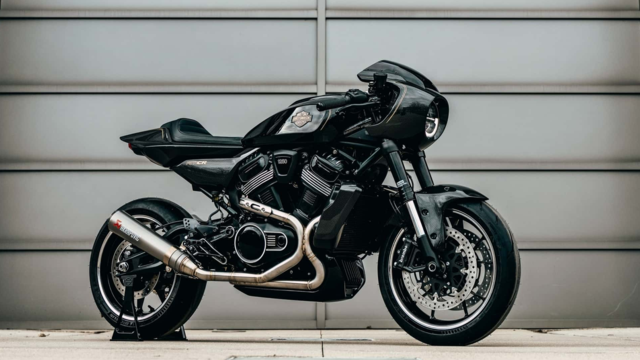
Harley-Davidson Reveals Super Cool Cafe Racer Concept
Verdad Gallardo
Engraved Rebellion: Inside Bundnerbike's Glam Rock II
Verdad Gallardo
10 Motorcycles You Should Never Buy
Joe Kucinski
10 Things Harley-Davidson Needs to Fix in 2026
Verdad Gallardo
Cruiser
Joined: Nov 2005
Posts: 163
Likes: 10
From: Wherever I put my helmet
Will the vtune data collection set to dyno work without the dyno? I always thought there was something different in the data that would invalidate it for street use vtuning. Never thought to look at it from your point of view.
Thread Starter
|
Road Warrior
Joined: Mar 2013
Posts: 1,923
Likes: 587
From: Alorton, Illinois
My understanding is when set to dyno. You don't need as many hits for each cell, because you have much more control with eddy brake and such. Maybe SC will field that one.