When you click on links to various merchants on this site and make a purchase, this can result in this site earning a commission. Affiliate programs and affiliations include, but are not limited to, the eBay Partner Network.
Ignition/Tuner/ECM/Fuel InjectionNeed advice on ignition issues? Questions about a tuner? Have questions about a EFI calibration or Fuel Injection? Tips on Engine Diagnostics, how to get codes, and what they mean. Find your answers here.
Actually, chose that log to work with because it has all my latest changes. Unfortunately it is missing the most aggressive parts of the ride ( WOT, powering through some twisties ) because I shut the bike down waiting for a train and forgot to start the log again.
Sometime this week I will try (weather permitting) to get a longer log and try to hit more areas, but here is one from an earlier tuning run hitting those areas ( has some minor differences is rear spark tables, some others. )
Last edited by IKnowNot; Mar 14, 2016 at 01:24 PM.
If you make the color the same thing on both sides, it is easier to figure out what you are looking at. In your example above, I would make the z axis = Advance F.
If you tag any point on one side the other side will circle where it happened on the the other page. The log screen will also jump right where your were at. They are all synced. It really helps getting your head around what is going one at any point in the log.
Actually I have been playing with that. Picking a point, checking the time stamp, then looking at the spreadsheet to see exactly what it is doing ( trying to get used to the patterns and what is where in them.)
I even put the two logs together to see the entire range.
Only problem I am having is that damn mouse-over keeps getting in the way.
At the end, I cover scatter plots and what they are.
Andy
Thanks for the link! I'm still confused though. I just can't figure out how I can adjust anything using those scatter plots with any precision.
I currently pull data logs and import them into Excel and sort them. Doing so, I can make VE table numeric changes based on those logs. How do I do that using those scatter plots?
I want to use the scatter plots but I really don't know how to make changes based on what I see.
When I use the data import Excel method, for example I can see a CLI % change and see that ECM is changing the VE table from 96 to 108 at 3200 RPM/ MAP load 65. I can go into the MAP and edit the VE table based on that. Maybe I shouldn't be doing that.
How do I use the scatter plot method to do the same? How do I know how much to adjust the VE tables based on the scatter plot?
If you are talking about adjusting fuel with scatter plots, it may be better to start a different thread. I have that sorted.
Andy
I'm asking about both the VE tables and the spark tables. I want to know how to import my logs into the software and how to make changes to my VE tables and spark tables based on what I see on the plots. As I indicated before, I have been using Excel to import the logs and make those changes. Where is the thread that you reference that explains how to do this? I searched the internet using your user name and saw numerous posts on a number of EFI forums (alot non Harley). None of them really explained in detail a step by step process on how I would use this software to make changes to my VE or spark tables. For someone that promotes this software, you seem to be pretty elusive about explaining in detail how to use it to an end user.
Why don't you start a post that explains the step by step process of how a novice user like me should use the software. I'm frustrated. I imported my logs into the viewer and I can't make heads or tails of what those plots are showing me. Its way more confusing than the spreadsheets.
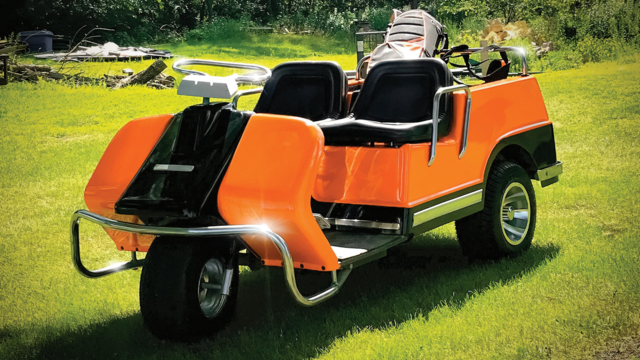
7 Surprising Harley-Davidson Products that Are Not Motorcycles
Slideshow: The bar-and-shield logo shows up on far more than motorcycles, some of the company's most unexpected products have nothing to do with riding.
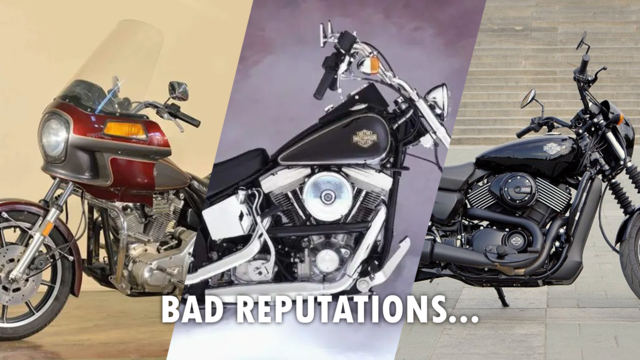
Slideshow: From the troubled AMF years to modern misfires, these bikes earned reputations for reliability issues, questionable engineering, or disappointing performance.
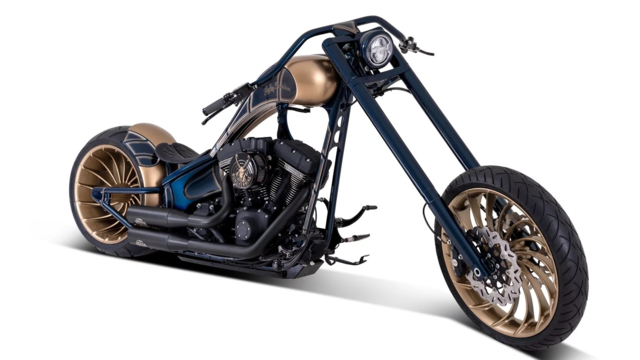
Crazy Bunderbike Build Looks Amazing, But Is It Impossible to Ride?
Slideshow: The Swiss custom shop has taken a Harley Softail and stretched it into something so long and low that it looks closer to a rolling sculpture than a conventional motorcycle.
Engraved Rebellion: Inside Bundnerbike's Glam Rock II
Slideshow: A standard cruiser becomes an intricate metal canvas in the hands of a Swiss custom house known for pushing Harley-Davidson platforms far beyond their factory brief.
Slideshow: Harley-Davidson's challenges aren't abstract; they show up in dropping shipments, shrinking dealer traffic, and strategic decisions that aren't yet translating into growth.